Train your first model
The sidebar lists five steps: Data, Target, Train, Results and Predict & export. Each one opens when the step before it is done.
Start with an example
For a first run, try one of the built-in examples. House prices takes about a minute from start to finish.
1. Data
Upload a CSV or Excel file, up to 50 MB, or choose Use this under one of the
three Sample datasets. Excel files can be .xlsx, .xlsm or the older .xls.
The file needs a header row, then one row per example and one column per
detail, the way most spreadsheets already are. In a workbook with several
sheets, the Studio reads the first sheet that holds a table and tells you which
one. An older .xls workbook is always read from its first sheet.
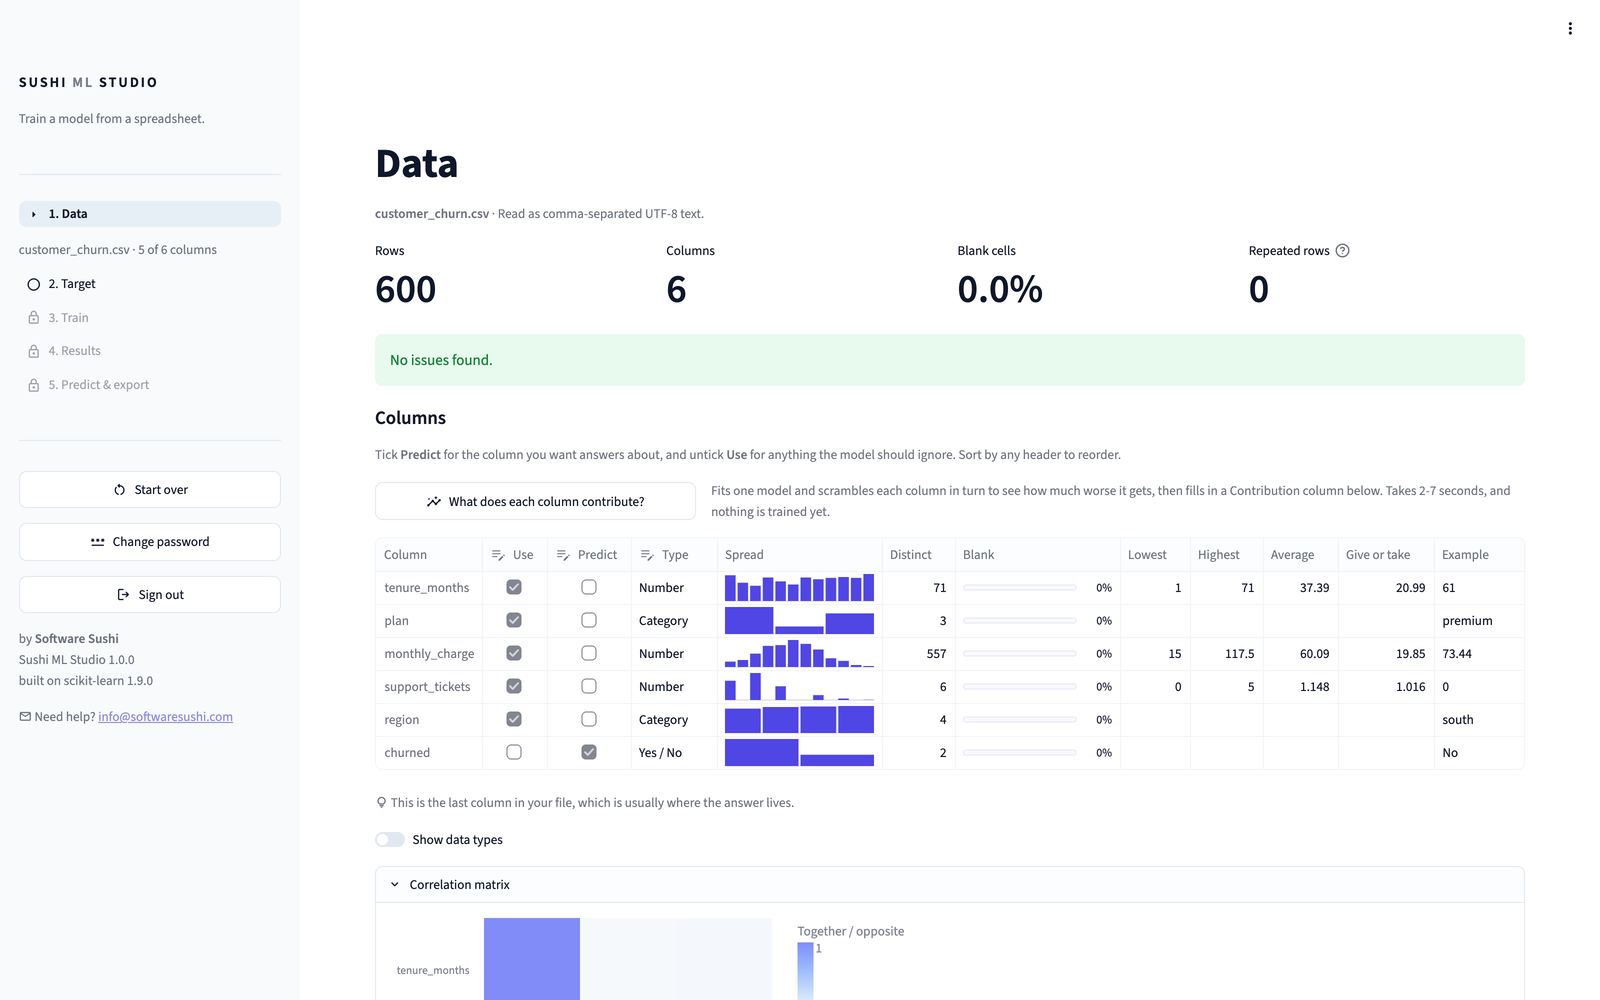
The Data page then shows:
The file at a glance. How many rows and columns it has, what share of cells are blank, and how many rows repeat. Below that are notes about anything that could mislead a model, such as an ID column, a column with the same value in every row, or one that is mostly empty.
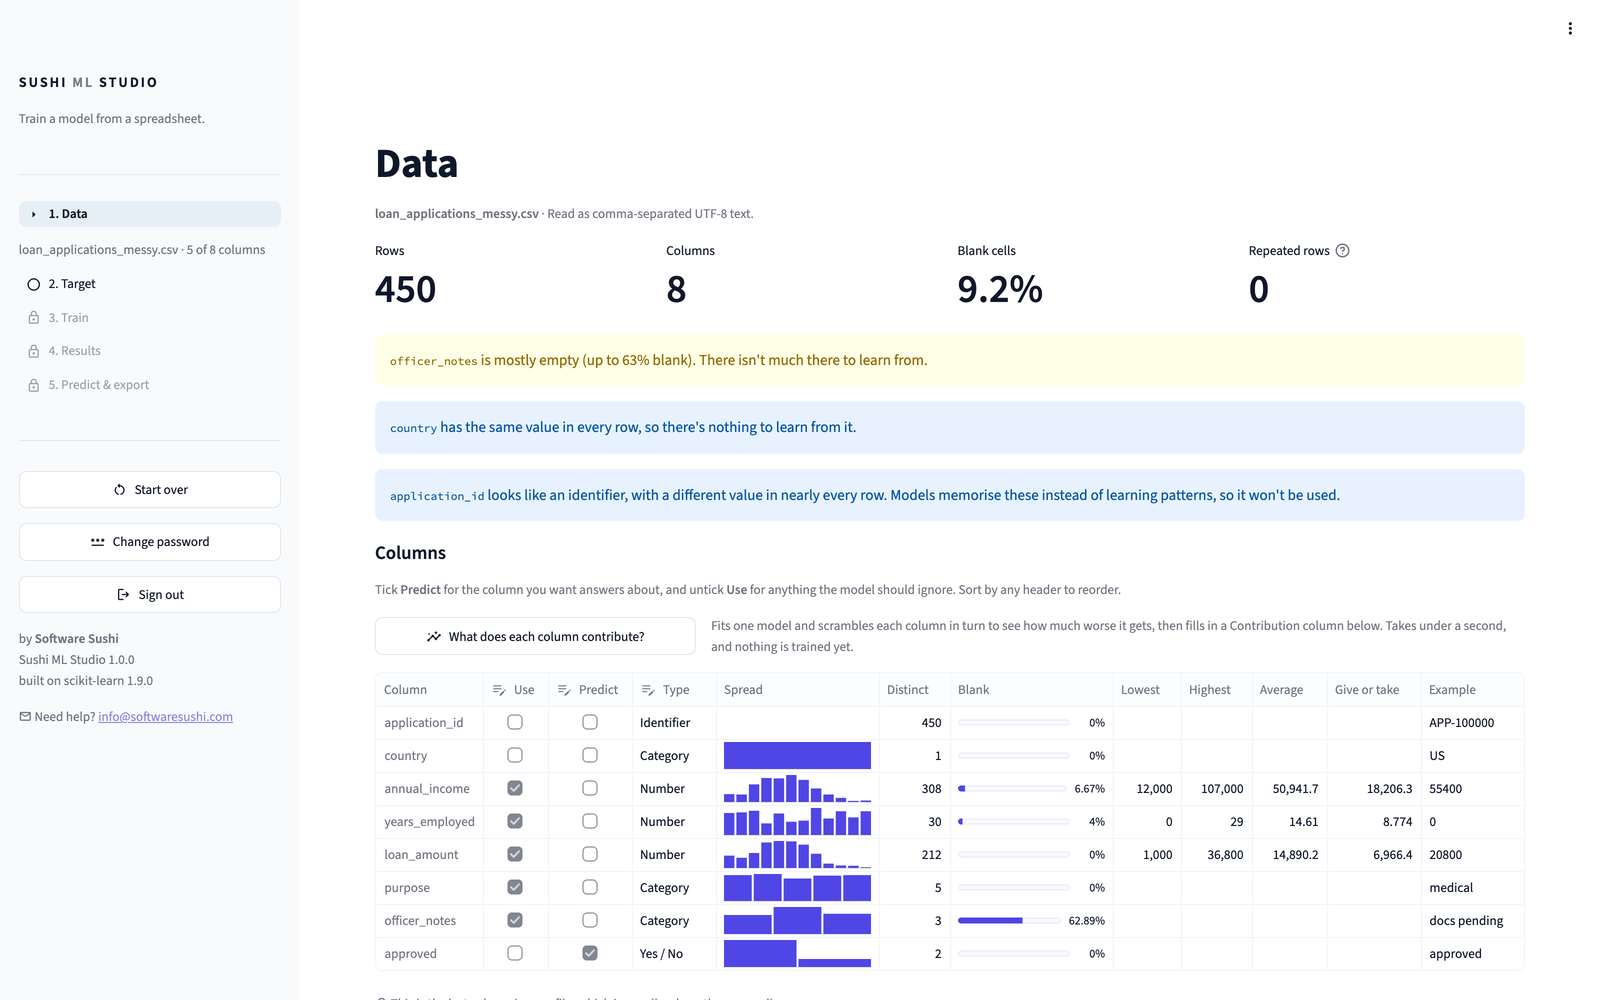
The column grid, with one row for each column of your file.
- Tick Predict on the column you want answers about. The Studio starts with the last column it can use, which is usually where the answer lives.
- Untick Use on anything the model should ignore.
- Type says how each column is read. Switch a number to Category when its values are labels rather than quantities, such as a store number.
What does each column contribute? measures, in a few seconds, how much each column helps with the prediction, and fills in a Contribution column. If some columns make no measurable difference, Drop the ... with no measurable effect unticks them for you.
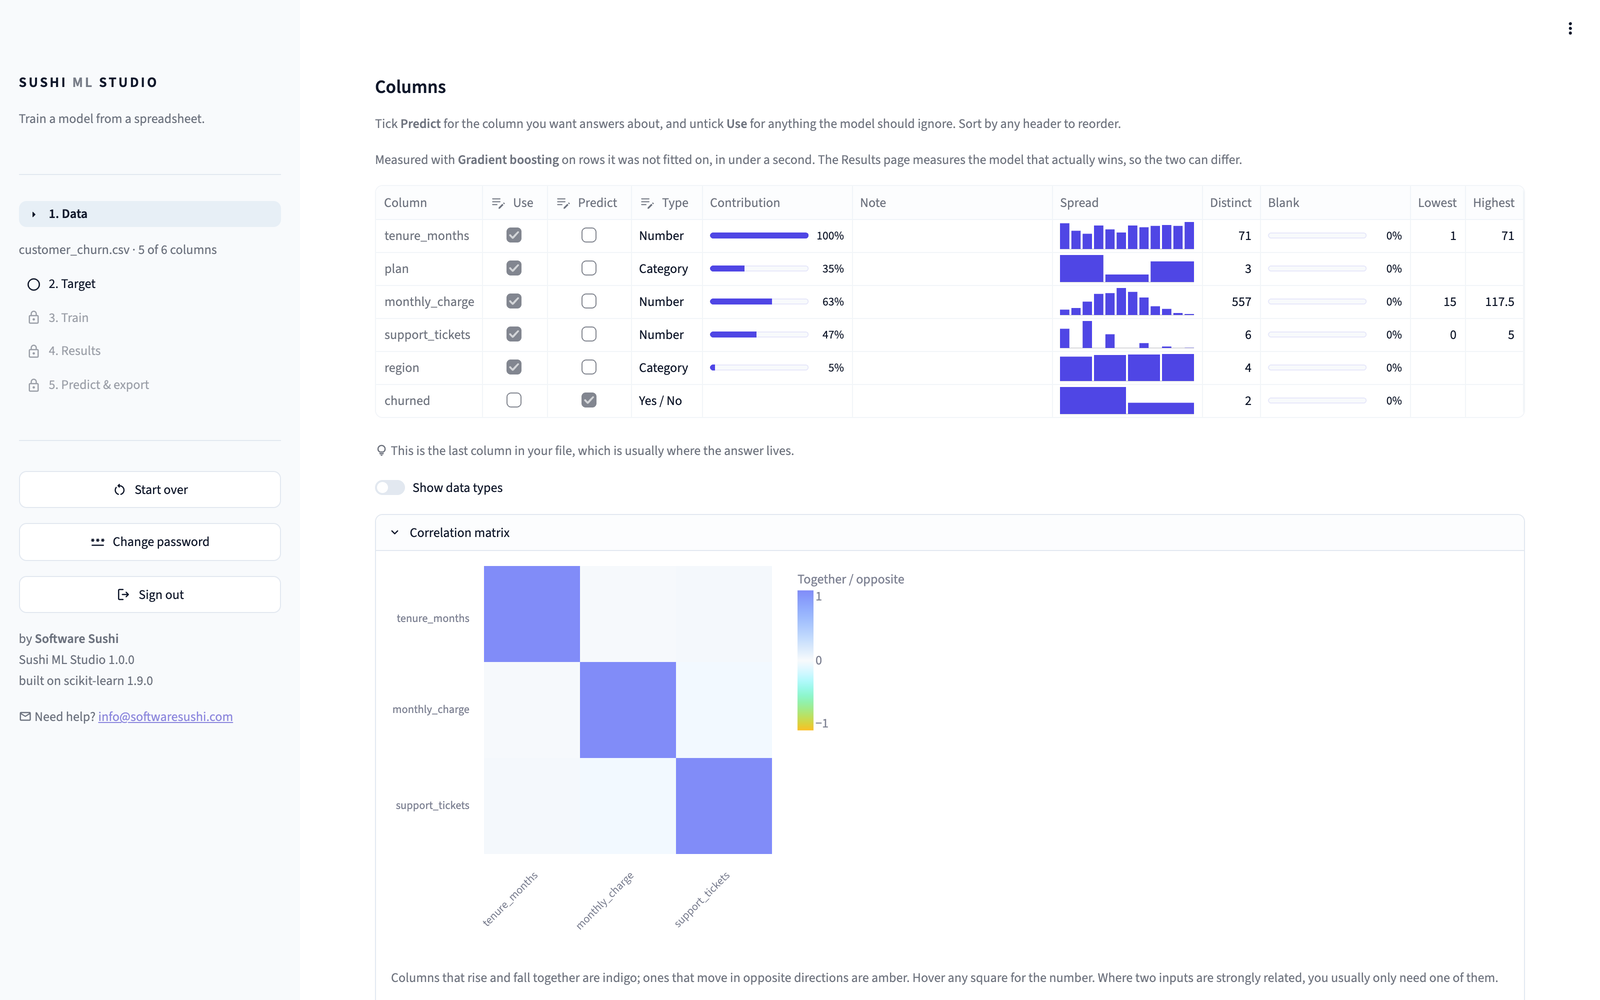
Correlation matrix shows which number columns rise and fall together.
When you are happy with the columns, choose Continue to Target.
2. Target
This page shows the column you are predicting and what kind of prediction that is:
- Sort rows into groups when the answer is a label, such as Yes or No, or one of up to 50 categories. This is classification.
- Predict a number when the answer is a quantity, such as a price. This is regression.
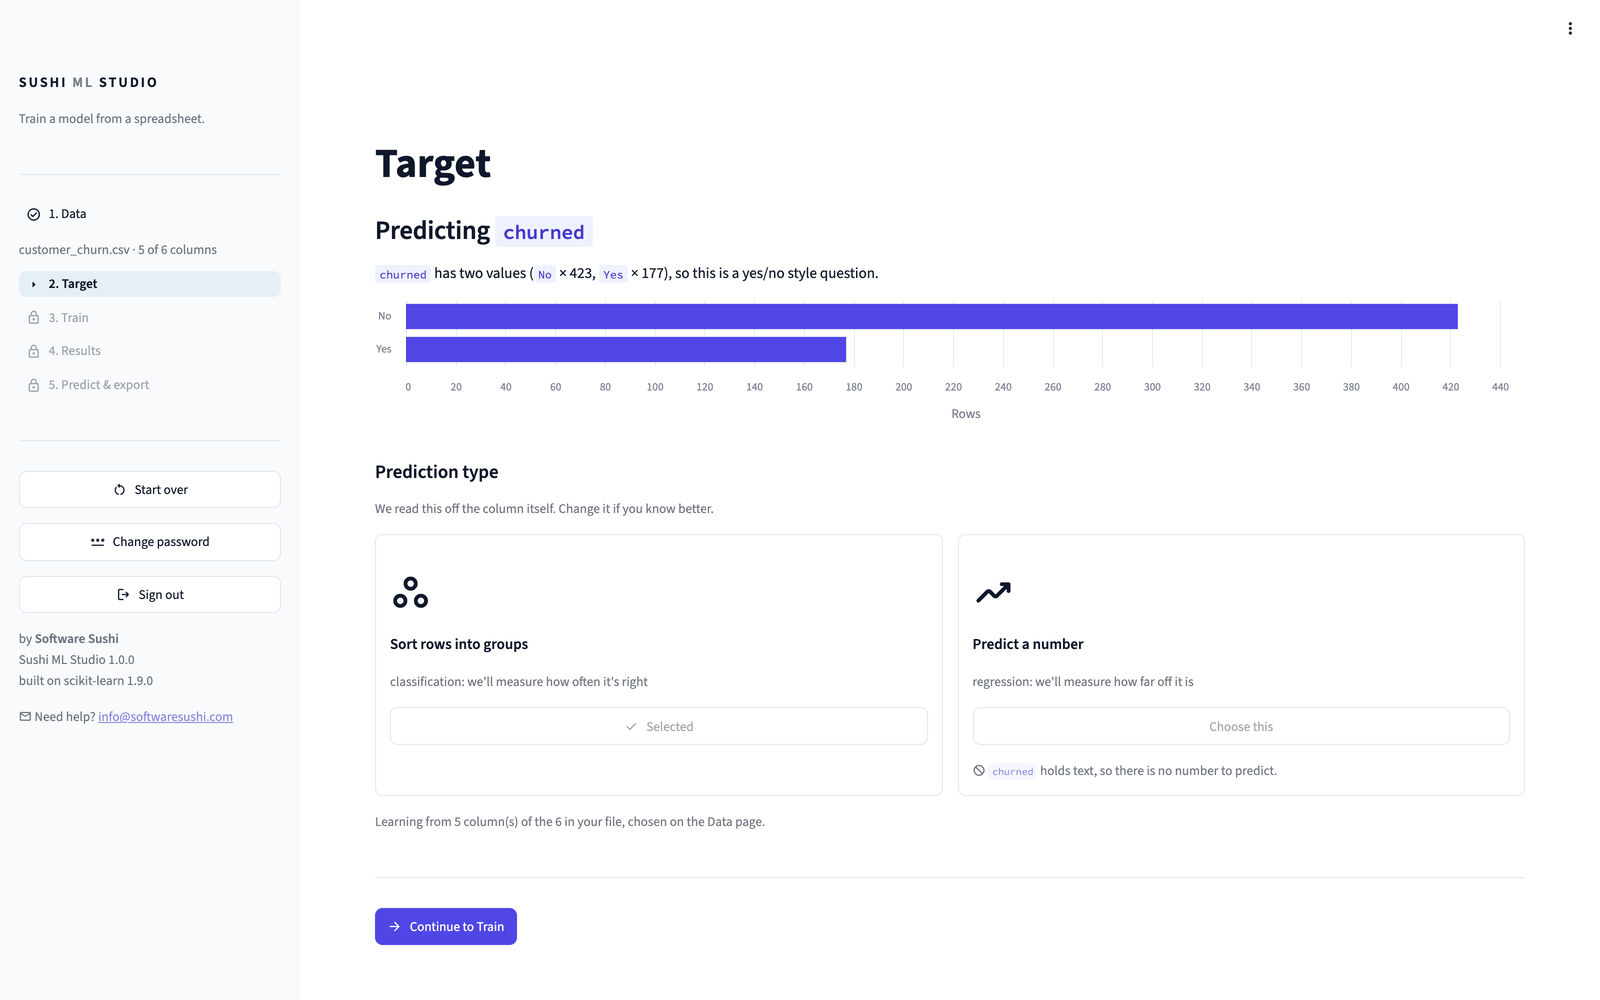
The Studio works this out from the column itself. Change it if you know better. Date columns cannot be ticked to predict, and free text or text IDs are refused with a sentence saying why.
Check it is not a row ID
A column of row numbers, such as customer_id, can be ticked like any
other number. Predicting it means nothing, so make sure the column you
pick is a real answer.
3. Train
Seven models are ready and ticked. Each card says when that model tends to do well. Untick any you want to skip.
Gradient boosting, random forest, logistic regression, nearest neighbours, decision tree, extra trees and naive Bayes.
Gradient boosting, random forest, ridge regression, nearest neighbours, decision tree, extra trees and elastic net.
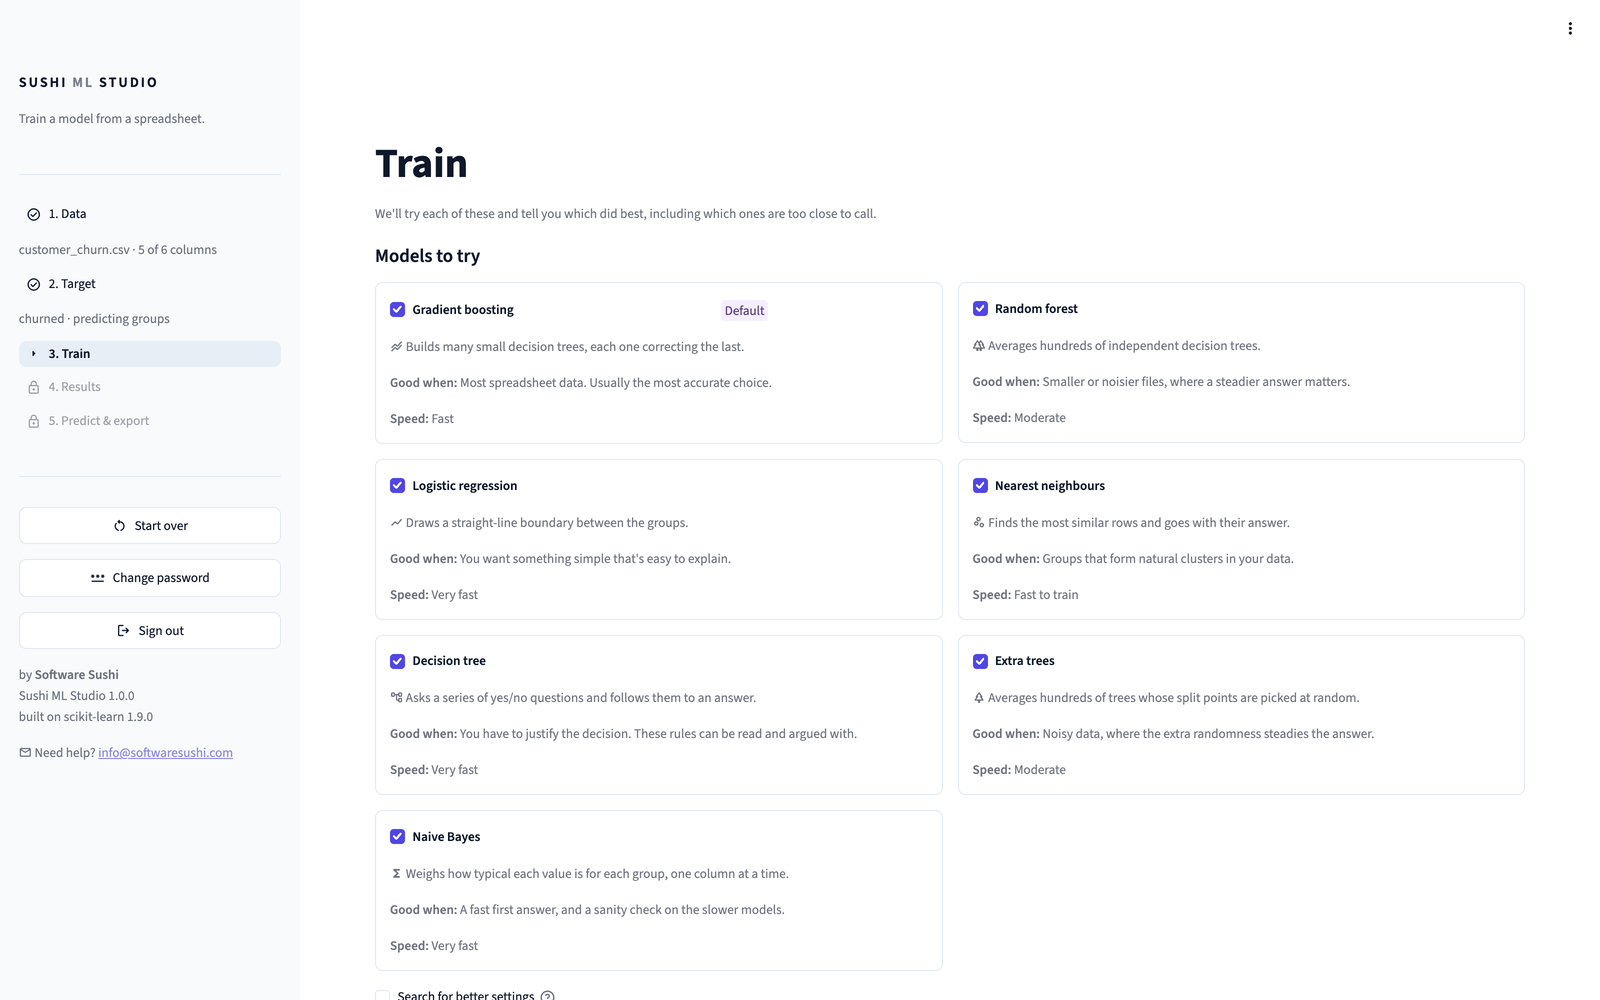
Two options sit below the models:
Search for better settings tries several combinations of settings for each model and keeps the best. It takes longer, and the Results page says whether it actually helped.
How it's measured decides which rows are kept aside to test the models:
| Option | What it does |
|---|---|
| Choose for me | Five-fold cross-validation for files under 1,000 rows, and a fifth of the rows held back otherwise. The default. |
| Hold rows back | You choose the share of rows held back, from 10% to 40%. |
| Cross-validate | Every row takes a turn in the test set. |
With Search for better settings on, a fifth of the rows is always held back to judge the search, so Cross-validate is not offered.
Adjust settings, on every card except naive Bayes, lets you choose a few of that model's settings yourself, such as how many trees a random forest has and how deep they may grow. Pick values, then choose Use these settings. The card then says which settings you chose, and that model is also trained a second time with them, as a separate custom version beside its defaults. Choosing the defaults, or Clear, removes it.
Choose Train 7 models, or Train and tune 7 models with the search on. Most files take a few seconds. When training will take longer, the Studio estimates the time before you start. Keep the tab open while it works.
4. Results
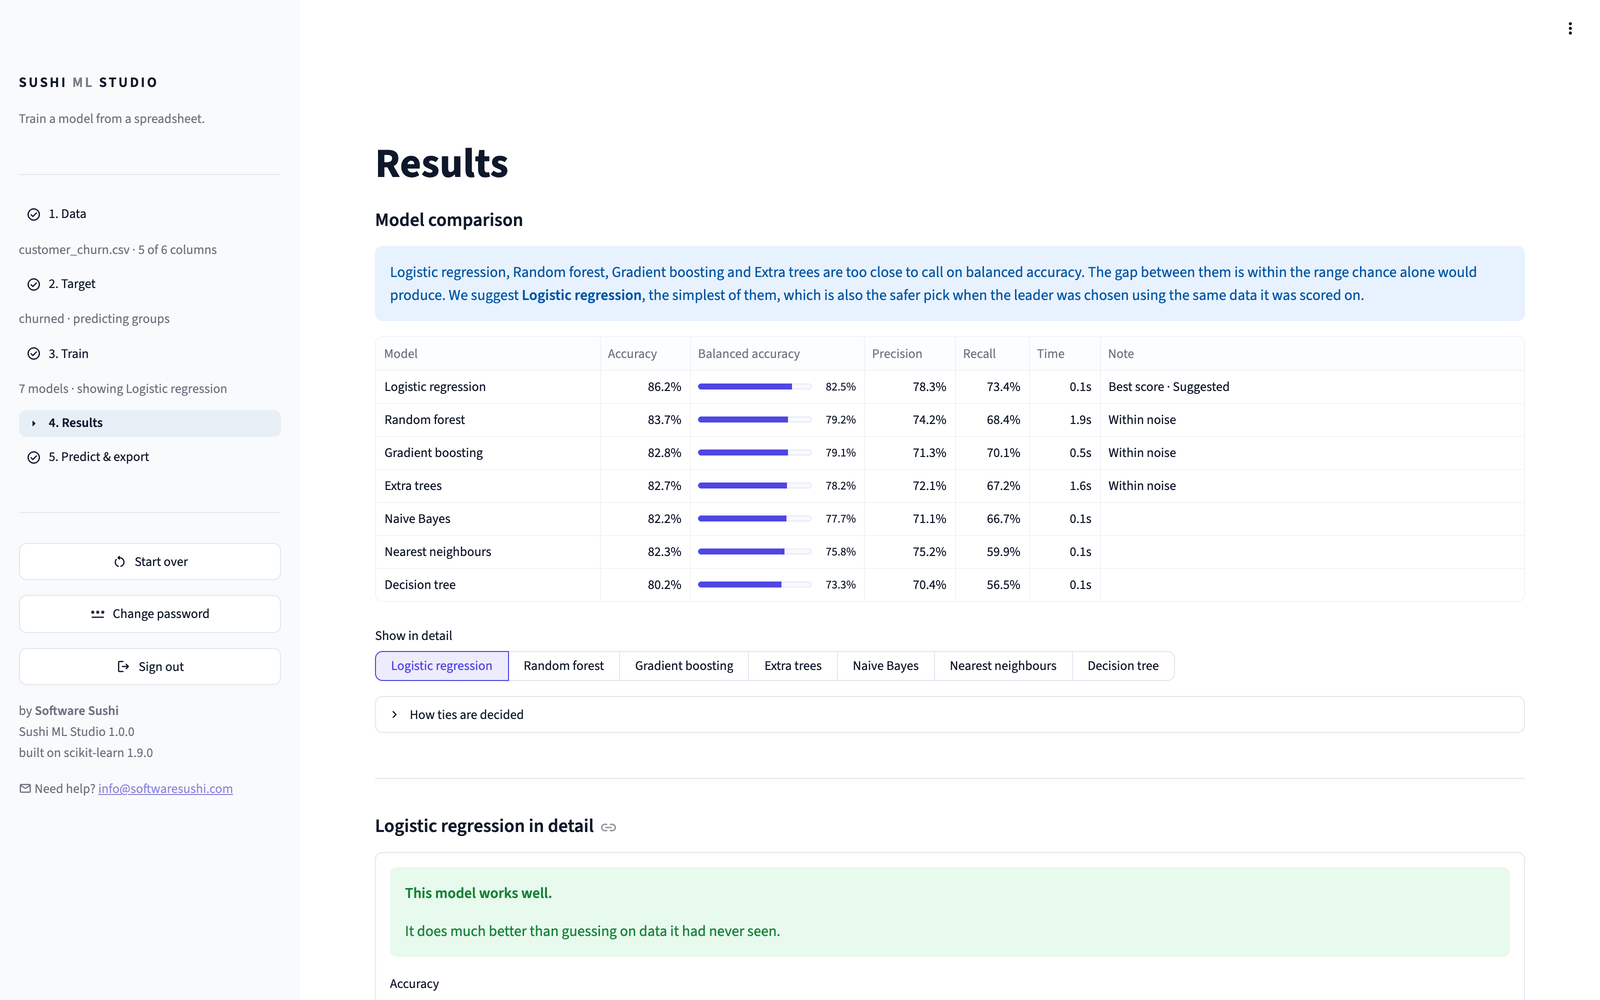
Model comparison lists every model with its scores on rows it never saw during training. The Note column marks the Best score, the models Within noise of it, and the one Suggested. When several models are too close to call, the Studio says so and suggests the simplest of them.
Show in detail picks which model the rest of the page describes. It starts with a plain verdict, such as "This model works well", or a clear statement when a model has not learned anything useful. Below it is the headline number: how often it is right when sorting into groups (balanced accuracy when one group is rare), or how far off it typically is when predicting a number, next to what a simple guess, or chance, would have scored.
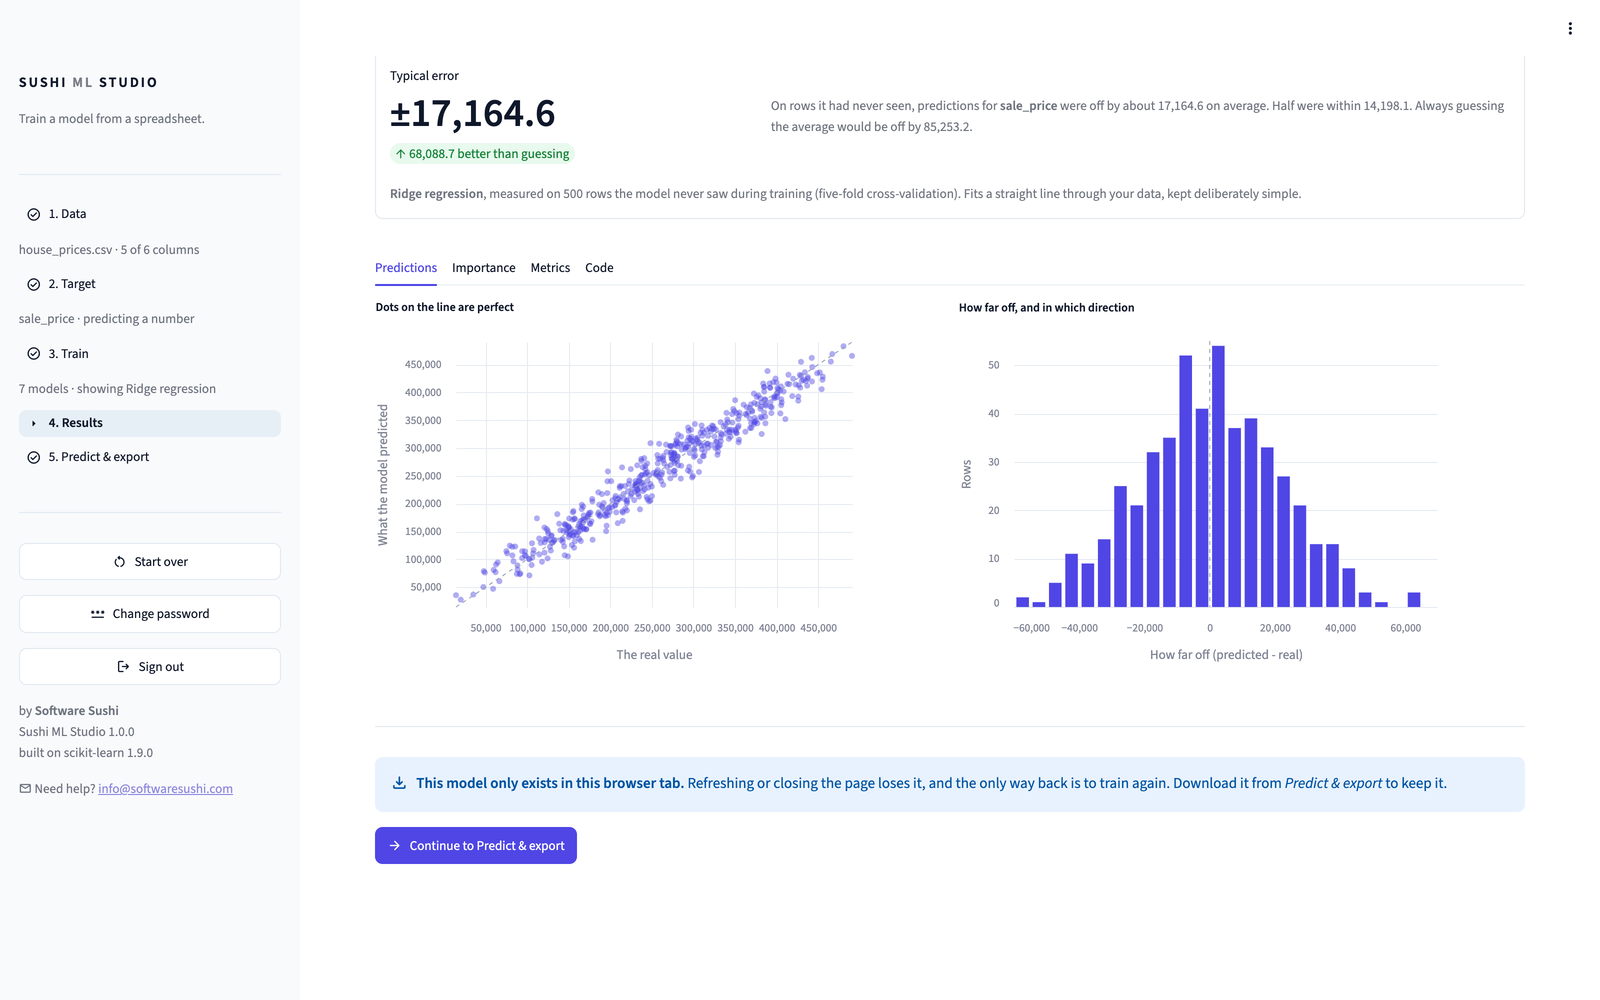
The tabs hold the detail:
| Tab | What it shows |
|---|---|
| Predictions | The model's answers charted against the real ones |
| Importance | Which columns the model relies on |
| Metrics | Every measure, with a sentence on what it means |
| Settings | The settings found by a search, or the ones you chose, beside the defaults |
| Code | How the model was built |
Adjust a model's settings
You can change a model's settings and retrain it, without retraining everything else. On Results, show the model in detail and choose the button under its verdict, for example Adjust Random forest settings. Move the sliders, then Retrain. Only that model is trained again, on exactly the same rows as the others, and it joins the comparison as its custom version, for example Random forest (custom).
Each model has one custom version. Adjusting it again replaces it, and Remove my version takes it away. On the Train page, changing a model's settings after training offers Train with my settings, which trains just the models you changed.
Each setting is named as scikit-learn names it, and shows its real values, so it matches the code you can export. Hover over the question mark beside it for what it does in plain words.
| Model | Settings | What they control |
|---|---|---|
| Random forest, extra trees | n_estimators, max_depth, min_samples_leaf |
Number of trees, how deep each may grow (None is no limit), fewest rows behind each answer |
| Gradient boosting | learning_rate, max_iter, max_leaf_nodes |
Step size, rounds at most, leaves per tree |
| Decision tree | max_depth, min_samples_leaf |
How deep the tree may grow, fewest rows behind each answer |
| Logistic regression | C |
How freely it fits; smaller holds it back more |
| Ridge regression | alpha |
How strongly it is kept simple; larger holds it back more |
| Nearest neighbours | n_neighbors, weights |
Neighbours to consider, whether closer ones count more |
| Elastic net | alpha, l1_ratio |
How strongly it is kept simple, and whether it shrinks every column or drops the weakest |
Judge a change by the comparison, not the number
A custom version is scored on the same held-out rows as every other model, and you can see those scores while you choose. Trying settings until one scores higher flatters it a little. The Note column says whether your settings beat that model's defaults by more than chance, and when models are too close to call, the Studio suggests the default version over yours.
A smaller model file
Random forest and extra trees grow their trees without a limit by default, which can make a large file on a large spreadsheet. Fewer trees or a depth limit make the file much smaller, often for little loss in accuracy.